KPIs and Metrics are key to driving a culture of data driven decisions. They show if you’re on track to achieve your objectives, strategic goals and give an indication of the business’s health. They allow you to observe, make decisions and adjustments based on underlying data.
KPIs (Key Performance Indicators): A collection of metrics (or single metric) used with a target. E.g., “Staff turnover rate”
Metrics: A defined measurement of something. E.g., “Company headcount”
KPIs are influenced by the Metrics that feed them, data, business processes and people that underpin them.
KPIs and Metrics underpin data driven decision making, these KPIs and Metrics will be the core of the analytics / business intelligence system.
So, what does that look like…?
Example:
There is a strategic drive to reduce staff turnover, one of the many Key Performance Indicators the HR department may use to measure this is the Staff Turnover KPI:
- The KPI “Staff turnover rate” is the number of leavers in the period ÷ number of employees
- The two Metrics that feed this are, “The number of leavers” and “The number of employees”
The Staff Turnover KPI will be measured over time, given a target and current value to see how the performance is tracking, but on its own this KPI is not helpful. You will want to drill down to see where staff turnover is highest, which months, countries or departments are outside the targets. Insight analytics, data science methods and data analyst, can assist here.
But still on its own, this KPI doesn’t allow you to make informed decisions, it’s a lagging indicator, it demonstrated something after the event. In this example the objective was to reduce staff turnover, you’ll need to find the leading indicators.
A leading indicator can give a warning of future downstream impact. A staff satisfaction KPI, Staff engagement KPI or Staff Absence Metric may highlight what will happen to staff turnover in the future. These indicators allow you to make a data driven change or decision to affect something in the future.
Your KPIs will have many interdependencies. They often use the same underlying Metrics and data. The result is a web of integrated indicators that displays the health of the business. This allows you to observe and act on what the data is exposing.
The modelling (arrangement) of KPIs, Metrics and data within your analytics / business intelligence platform is key to allow this integrated view, and give the ability to drill through your data quickly and seamlessly. Data modelling is a large topic and will be covered in another article.
The flow of information in data driven decision making:

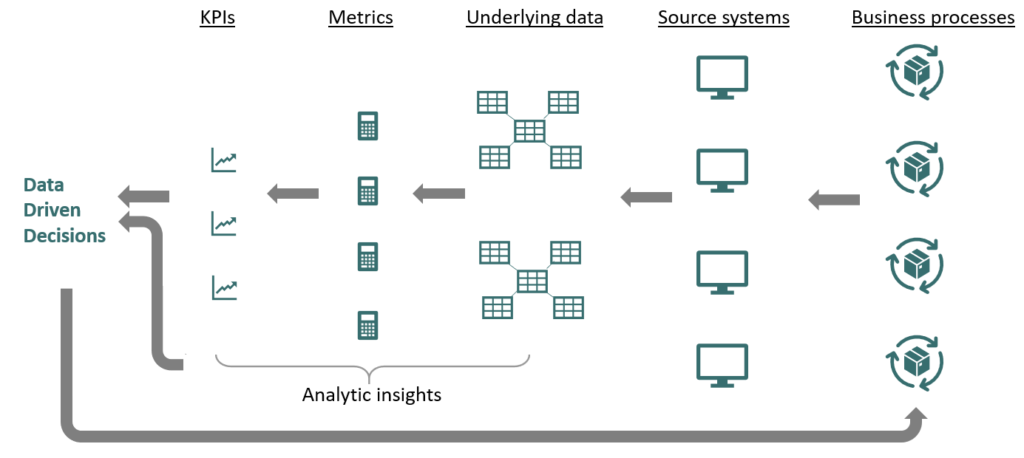
The image above shows how your business processes feed your KPIs and in turn how decisions you make on KPIs and Insights will drive your business processes.
Analytical Insights ; the use of analytical processes (data science and machine learning disciplines) or the application of domain knowledge (data analysts and domain experts), to uncover areas of significance in data.
This simple article will have given you a good idea of where to start with driving data based decisions in your organisation. There are many other articles on SimplyDataDriven that can help.


